


ZU-ITT – Proving flights and Fuel Vaporisation
- Jan 17, 2024
- 4 min read
By Ian Beaton and Theo Arrenbrecht
After completing the build of our wonderful RV10, we commenced with the proving flights. Now that meant some challenging accurate flying was to be required. As we have installed Garmin G3X’s we can download the data from each flight for analysis which Theo and I have spent many hours poring over. Theo is a chemical engineer and truthfully spent more time looking at the data than I did.

It started with the climb tests, full power and climb out at 80 knots, then 90 100 and 110. Should be simple. Off we went, did the flight and had some radio comms issues with Jhb info, which were not audible on the day in the southwestern sector so we were restricted in the height we could climb to. After a couple of runs, we returned to Tedderfield patting each other on the back about how nicely the ten flies and how we had done what was required, until we looked at the data and what in our minds was a nice steady climb, turned out to have variations in the speed range that we had been oblivious to. On talking to Trevor Warner, he recommended an early morning flight in perfectly calm conditions, well those don’t always exist, but we did it a few times and managed to get some reasonable data. However, on the climb maintaining the speed with only pitch input is still a rather large ask, interesting to be sure.

On further analysis, Theo being keen on balancing our injectors so we can maximise the benefits of flying lean of peak, peered deeper into the data and noticed that fuel flow fluctuated a little, as fuel flow is important to balance injectors we have monitored and measured what we can see.
It is a well-established and known issue with the RV10 that the tunnel gets rather warm and now your fuel system sits in there. There are some suggestions for fixes which we have implemented and the data is displaying a minor issue with what we believe to be vaporisation.

It is a well-established and known issue with the RV10 that the tunnel gets rather warm, now your fuel system sits in there. There are some suggestions for fixes which we have implemented and the data is displaying a minor issue with what we believe to be vaporisation.

This is evidenced by the following graph, extracted on a hot day:

Now in flight, with the boost pump on or off the issue is not noticeable at all, yet is evident in the data analysis. So what is the cause?
This thinking formed the basis of a fuel talk we gave at the EAA fly-in event to Tedderfield on 13th January 2024. Unfortunately, our projector could not compete with the time of day and the light streaming in through the skylights in my hangar meant the resolution on the screen was not adequate to see what was going on, I have asked Neil Bowden to publish the presentation on the EAA website for those interested in what we were talking about and you will see the details there. Anyway, when we tested on Friday afternoon the sun was in the west and it was adequate, one learns all the time.
Back to the story, we believe the issue to be related to the heat in the tunnel causing vaporisation of the fuel and the “bounce” in the trace is caused by the vapour passing through the flow meter. We are investigating alternatives to cool the tunnel and eliminate the issue completely without simply putting a sticking plaster on a festering sore.
I need to assemble an Arduino board with some temperature probes so we can find and eliminate the source of the heat. The tunnel can get extremely warm.
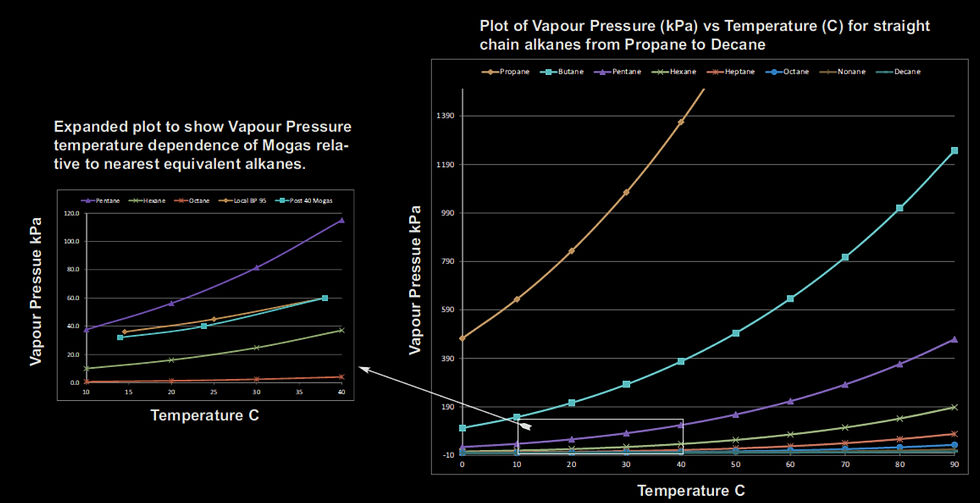
In our demonstration, we show how fuel vapourises using several methods and simple experiments. These are captured on video and make for interesting analysis. What it boils down to is the design of the fuel system, which in the RV is pretty good. Yet because we are operating here on the highveld and temperatures are hot and we are high the whole science of vapour pressure comes into the mix and the fuel system design for operation at higher ambient temperatures is critical. Vapour pressure rises exponentially with increasing temperature as reflected in these graphs:
Translating this to the thickness of the piping is reselected in this graph:

All of this is showing us that the fuel system is a compromise, and needs careful thought and installation. We will continue our research on the 10 as we can replicate the issue in the data and with a little more measurement to determine an optimal solution.
To close off, if on take off on a hot day your engine falters, it may probably be a vapour pressure-related issue, and therefore throttling back a little will reduce the fuel flow and as evidenced in the graph above, give you some power and perhaps allow you to fly away safely. The reason is that because of Bernoulli’s theorem, the velocity of the fuel flow is the culprit, (pressure is proportional to velocity squared, which in turn is proportional to pipe diameter squared, thus resistance to flow is proportional to the 4th power of pipe diameter, which is also illustrated in the graph above, and hence the criticality of the fuel supply line design.) so by reducing throttle setting, fuel flow and thus velocity in the fuel line is reduced and that has an exponential impact on reducing pressure drop in the fuel supply line, which will allow the vapour to see a higher net pressure, resulting in the vapour to collapse and thus restoring normal flow, allowing the engine to perform and you to fly away, albeit at reduced power. (Something is better than nothing).
Stay safe


Comments